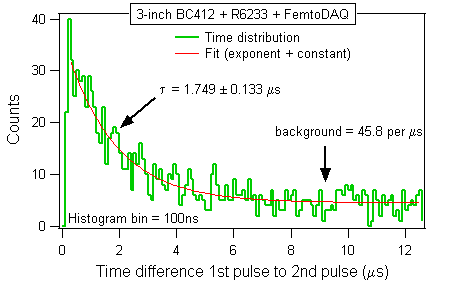
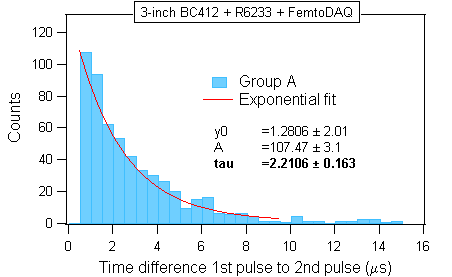
Figure C.1. Left: Measured interval distribution between the leading and the trailing pulses. Right: The same gated on Group A from Figure A.5. on the analysis page.
On this page we will describe the conclusions of the analysis described on the previous page . We will show the time and pulse height distributions obtained after removing the background of random events.
The experiment in the "vertical" detector geometry was documented on the experiment page. Over the course of five days, FemtoDAQ processed 3,512,000 events. It recorded 8,551 waveforms, out of which 1,531 were the decay candidates. The number of recorded "non-candidates" was (8,551-1,531) = 7020. The recorded file size was 53,704 kB.
We measured the time interval distribution between the leading and the trailing pulses in the multi-pulse events. The distribution shown in the first panel included all events with a substantial random background under the decay curve. The mu-meson life time obtained from the contaminated histogram was too short. We removed the random background by gating on event Group A shown on the analysis page. The cleaned distribution is shown in the second panel. The life time obtained from the clean distribution was in good agreement with the official value.
The successful cleaning of the time distribution from the random background demonstrates an essential technique which is widely used in experimental nuclear and particle physics. Background removal would not have been possible without detailed information that was provided by the FemtoDAQ digitizer.
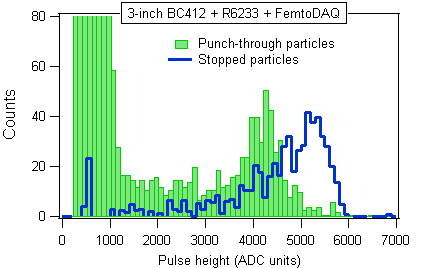
The energies deposited by the stopped mu-mesons were on the average higher than those deposited by the mesons that punched through the detector. The difference was due to the increased energy dissipation towards the end of the particle range (the Bragg peak of the stopping power). This feature was neatly demonstrated after the stopped meson distribution was cleaned from the random background (the thick blue line histogram).
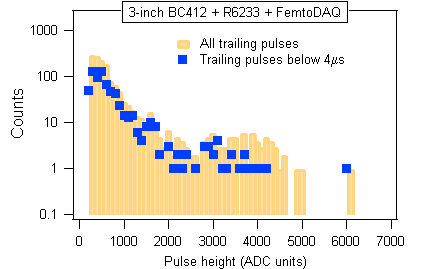
In case of the decay electrons, cleaning the pulse height histogram from random events was less conclusive than in the case of the stopped mu-mesons. The "bump" near the PH=4000 was not removed from the cleaned histogram. It remains to be investigated whether this bump can be attributed to the residual random coincidences, or it was a real feature deposited by some fraction of the emitted electrons.
We hope that you found our investigations both interesting and entertaining. We invite the feedback from anyone who is interested in either pursuing such investigations or in suggesting improvements and refinements to what we have done.